
ITSM Basics: The State of IT Service Desk Metrics as We Enter 2019
There are three common IT service management (ITSM) areas where IT service desks often state that they’re struggling, or at least say that they’d like more guidance and help. These are knowledge management, self-service, and metrics (performance management). There are of course probably many more, but these are three areas where there’s an expectation that the “tough nut should have been cracked by now.”
The first two areas continue to be problematic for service desks, but the latter is an interesting one – because, unlike the other two, it’s not a case of a “lack of employee adoption” but more of a sense of: “We can do so much better.” By this, I mean that while most service desks employ a set of performance metrics, probably chosen from the many available lists of “best practice” metrics, there’s a certain level of doubt as to whether these metrics are as good – or as relevant – as they could be.
As to why, there’s probably a variety of reasons. From people thinking that other service desks have better sets of metrics, through service desks not actually doing anything productive with the employed metrics, to people having a gutfeel that the currently-employed metrics are somewhat outdated relative to modern business wants and needs. (Especially given the changing support landscape thanks to new technologies and higher employee expectations).
If you’re currently questioning your IT service desk metrics, then this blog is for you.
What’s Currently Being Measured by IT Service Desks?
The Service Desk Institute’s (SDI’s) recent report – “Measuring and Making the Most of Metrics” – provides insight into this. Starting with the statistic that 90% of IT service desks employ formal performance metrics.
I’d have guessed that this percentage was higher, but this is what the survey results said – with it perhaps an indication of some smaller IT support teams in the sample. However, this is irrelevant to one of the key data sets provided by the report – that of the relative popularity of common IT service desk metrics.
As a bit of background, the SDI Global Best Practice standard specifies 39 different metrics and the survey included 20 of these, with the adoption rates detailed below.
Which of These Do You Measure?
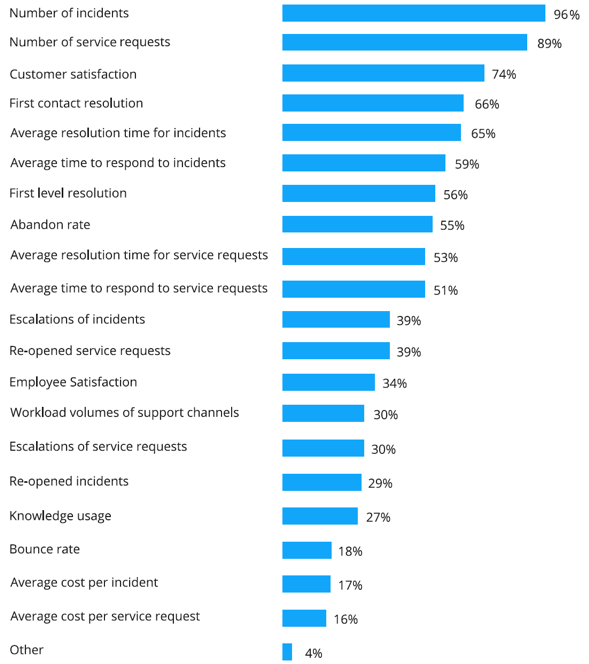
Source: SDI, “Measuring and Making the Most of Metrics” (2018)
Unsurprisingly, the volumes of incidents and service requests, i.e. the number of tickets received and handled, are the top two most-commonly used IT service desk metrics – at 96% and 89% adoption levels respectively. Beyond these two though, there’s a rapid drop off in common metric usage. Plus, some very surprising levels of metric adoption – and non-adoption. I’ve chosen a few to dig into.
Customer Satisfaction
This metric is third in the list but it’s only at 74%, i.e. one out of every four IT service desks doesn’t garner feedback, on how well they’re doing, from the people they serve.
In 2018, and moving into 2019, with the increased focus on customer/employee experience (thanks in part to consumerization) it seems odd that 26% of the service desks that use formal metrics aren’t soliciting end-user feedback. If only because it’s free consultancy on how well the employed service desk people, processes, and technology are faring as an organizational capability.
“Average Resolution Time” and “Average Cost Per Incident”
Only two-thirds of IT service desks measure how long it takes to resolve incidents versus the 96% that measure the volume. It’s somewhat of a “quantity over quality” view of incident management efficiency.
Then, much further down the list, only 17% of IT service desks measure the “average cost per incident” (again versus the 96% that measure the number of incidents). It’s not unsurprising but, along with the average resolution time adoption level, it’s worrying that – with all of the reporting capabilities available within modern ITSM tools – service desks ignore such efficiency-related metrics.
Of course, it can be difficult to compare your service desk against an industry performance benchmark such as “average cost per incident” – because so many different parameters come into play, such as the types of incidents and the complexity. Then which costs do you include, and which do you ignore? With the difficulty of peer-based comparison added to when organizations are successfully employing a self-service capability, say (because the service desk is then only likely to receive the most complex issues – which increases both the average resolution time and average cost per incident).
However, there’s no law that says these metrics need to be benchmarked against others, with the month-on-month trending of in-house results a great way to identify and share efficiency-based improvements.
Abandon Rate
Only half of service desks measure call abandon – or abandonment – rate. This seems crazy – unless, of course, the service desk has no way of tracking how many callers hang up before being served (but it should be a common telephony-system feature).
But without this insight, many of the other performance measures become less accurate. For instance:
- Customer satisfaction is probably missing the 5%, say, of calling end users who – post call abandonment – might want to give a low feedback score
- Average speed to answer is distorted by the 5%, say, of callers that “give up” on waiting (although I appreciate that some of these might hang up due to reasons other than the service desk’s delay in answering)
- Are ticket (well, issue) volumes understated due to the missing calls and thus issues?
Plus, is an abandoned call potentially an employee who will never try to get help from the IT service desk again?
Employee Satisfaction
Only a third of IT service desks measure employee satisfaction. Or, viewed differently, two-thirds of service desks don’t measure how well IT support operations are working from a staff perspective. And, within this, how service desk staff feel about: their work, their role, and the wider IT organization and business.
Given that IT service desks can be difficult places to work – due to the constant pressure of high workloads and the type of interactions had with the people that need supporting – it seems illogical not to garner feedback by those affected by the IT support environment. It’s also a missed opportunity to reduce the high levels of staff turnover, and its impact on knowledge retention, commonly associated with IT service desk teams.
I live in hope though – that we’ll get collectively better at performance measurement and reporting in 2019. That the increasing focus on customer and employee experience will drive a radical rethink of the “good practice” for IT service desk metrics – with the emphasis placed on quality more than quantity, and on experience/satisfaction more than efficiency (which is fine because speed is a big factor in experience/satisfaction anyway).
How do you measure your service desks performance that’s different from the list above? Please let me know in the comments.