
Is Call Abandonment Rate a Misunderstood IT Service Desk Metric?
IT service desks are probably the most measured – in terms of performance – part of the IT organization. And they, and their people are “bending over backwards” to improve the quality of IT support and, increasingly, the end user, employee, or customer experience.
Such service desks are likely charged with delivering against the mantra of “better, faster, cheaper” – with the latter of these, the need to cut costs, a common pressure for IT service desks over the last decade. The speed of resolution (or provisioning) is also important, as shown in the list of most commonly-used IT support metrics below.
But there’s another common metric, within the list, that deserves greater thinking and debate (and probably action) in the context of improving the end-user experience – the call abandonment rate, which is the number of abandoned calls (meaning the customer hung up before an agent answered the call) divided by the total number of incoming calls.
Here @Joe_the_IT_guy looks at some of the most commonly-used #IT support metrics and the impact of the Call Abandonment Rate. #ServiceDesk Share on XThe Most Commonly-Used IT Support Metrics
Let’s take a look at the 2018 HDI Technical Support Practices and Salary Report, which shows the top 10 metrics tracked/measured by IT support organizations to be:
- Average time to resolve tickets
- Customer satisfaction with ticket resolution
- Abandonment rate (phone)
- Customer satisfaction with support overall
- Average number of tickets resolved per staff member
- Average speed to answer (phone)
- Average talk time (phone)
- Average handle time (phone)
- Average time to respond to desktop support tickets
- Average time to resolve desktop support tickets
It shows call abandonment rate to be the third most-used measure, and the average speed to answer the sixth. Such telephony metrics are common because IVRs/ACDs spit the numbers out automatically and support managers don’t have to design or calculate the metrics.
However, when desktop support is excluded, such that it’s a support-center-only perspective, the report shows the top 5 metrics tracked/measured by support centers are as follows:
- Average time to resolve tickets
- Abandonment rate (phone)
- Customer satisfaction with ticket resolution
- Customer satisfaction with support overall
- Average speed to answer (phone)
With both abandonment rate and speed to answer rising a position – and it’s important to note that abandonment rate is now higher than “customer satisfaction with ticket resolution.”
Does that feel right? Not so much! And so, my concern about the use of call abandonment rate as a metric goes even further…
How Well Does IT Support Answer the Phone?
The same HDI report also offers insight into the average performance against both of these telephony measures.
Starting with response time, only 81-90% of tickets submitted via phone meet the stated service level agreement (SLA) (median), with the average speed to answer shown below:
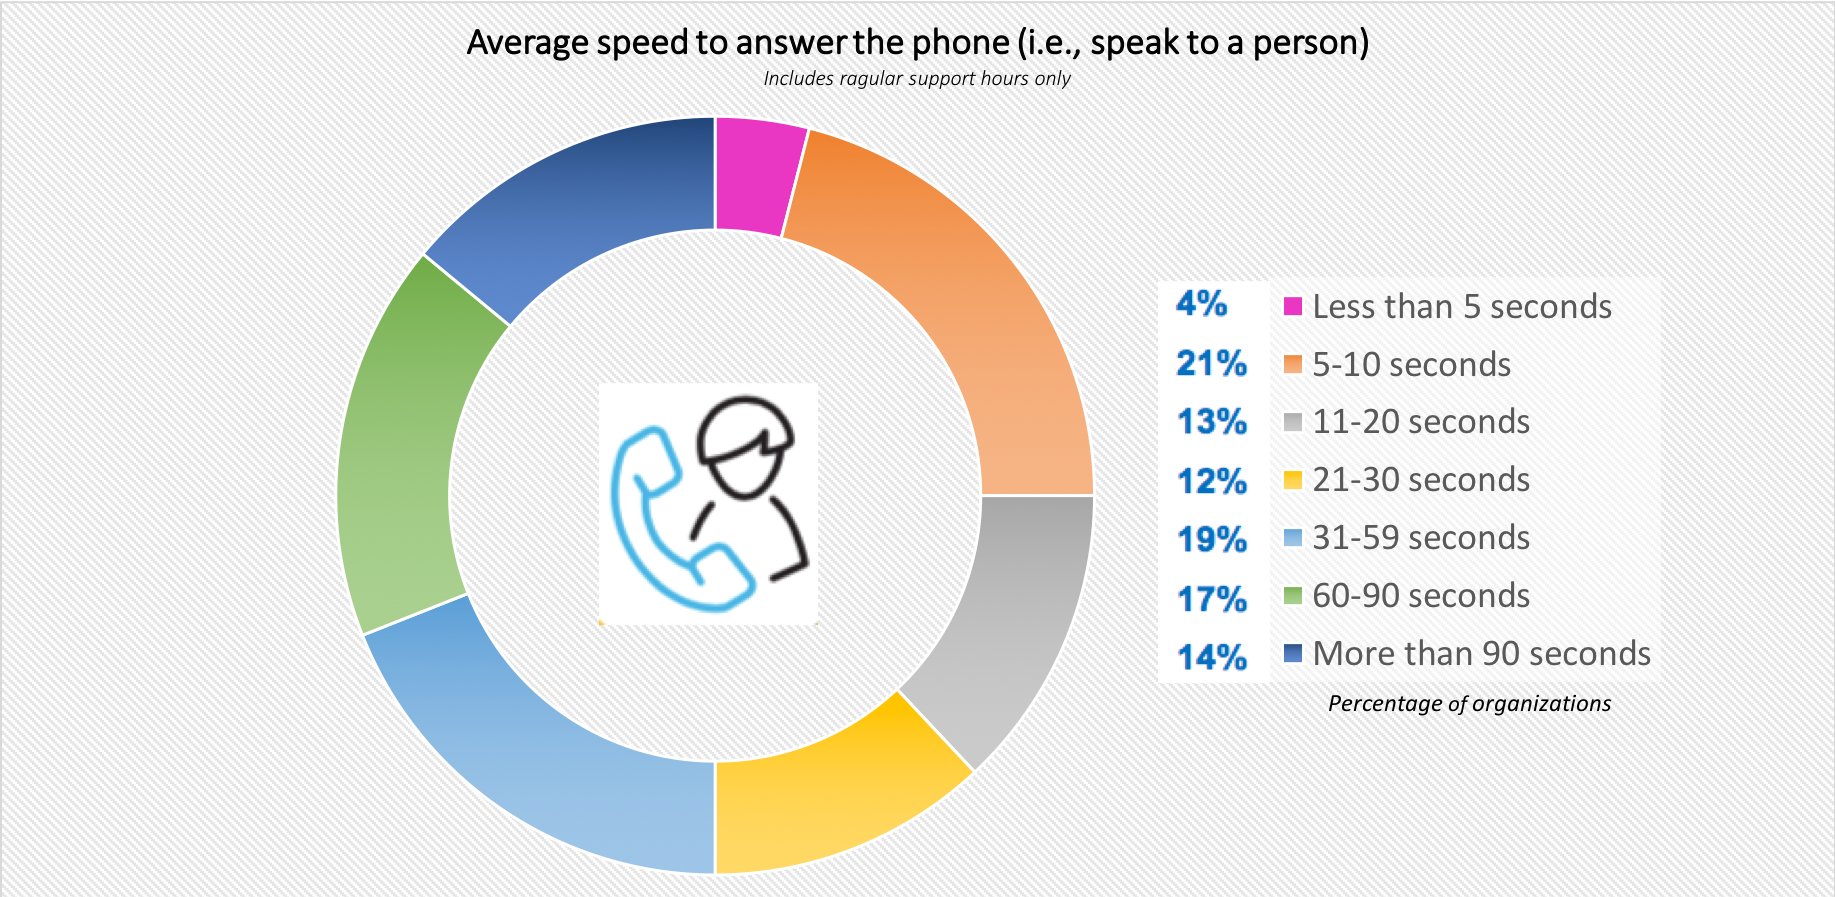
Source: HDI, 2018 Technical Support Practices & Salary Report
Despite the low level of SLA achievement, and based on what employees might experience, support-wise, in their personal lives – I don’t think these wait times are excessive. I’m sure most of us have had to wait 20+ minutes to speak with, say, a telecom provider’s customer service team.
But perhaps they are, when abandoned calls are considered?
91-100% of tickets meet the stated SLA for call abandonment (median). This sounds good until the percentage of abandoned calls is understood as per the chart below:
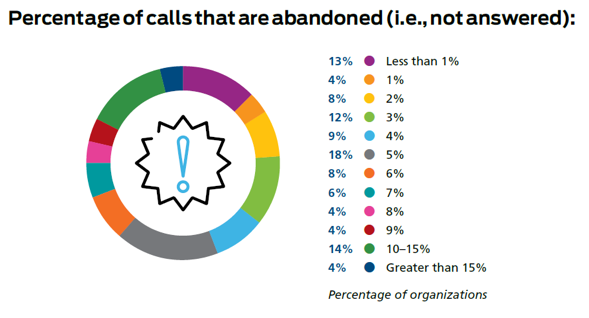
Source: HDI, 2018 Technical Support Practices & Salary Report
It’s even easier to understand when looked at from a cumulative perspective:
| Abandonment Rate | Percentage of Organizations | Cumulative Percentage of Organizations |
| Less than 1% | 13% | 13% |
| 1% | 4% | 17% |
| 2% | 8% | 25% |
| 3% | 12% | 37% |
| 4% | 9% | 46% |
| 5% | 18% | 64% |
| 6% | 8% | 72% |
| 7% | 6% | 78% |
| 8% | 4% | 82% |
| 9% | 4% | 86% |
| 10–15% | 14% | 100% |
| Greater than 15% | 4% | 104% |
This adds up to 104% due to rounding
There are two important datapoints here:
- Half of organizations “lose” the caller 5% or more of the time. While this might not sound a lot, it’s every twentieth caller – which doesn’t sound great.
- 18% of organizations “lose” the caller 10% or more of the time – this can be considered every 10th caller abandoning their call.
Obviously, some of this might be attributed to reasons other than “impatience,” for instance:
- The caller being distracted or called away while calling
- Taking the in-queue advice to try the self-service portal instead
- Hanging-up due to the IVR message stating that a major incident is already known about
But does this do a disservice to the end user and the organization as a whole?
Thinking About the Telephony-Based Metrics Logically
Hopefully you’ll agree with the following four statements:
- Dealing with IT issues is important – it’s why organizations have IT service desks.
- Dealing with IT issues quickly, and consistently quickly, is important – it’s why IT service desks offer SLAs that aim for 90%+ target achievement.
- Telephony is an important IT service desk channel – it’s still the most popular for many organizations (and their employees).
- “Abandonment rate (phone)” and “Average speed to answer (phone)” are two of the most popular IT service desk metrics.
But is the following as logical? We’re in a situation where:
- There’s a relatively high level of call abandonment but it still meets the relevant SLA 91-100% of the time, i.e. it’s OK for people to hang up due to the delay in answering the phone.
- The speed of answering only achieves its SLA 81%-90% of the time, i.e. phone calls aren’t being answered quickly enough and “it matters.”
Is it just me or does this seem illogical?
Some people will say “Well, the high level of call abandonment doesn’t adversely affect our customer satisfaction (CSAT) scores.” Of course, it doesn’t! The caller doesn’t get to log a ticket and therefore doesn’t get a chance to complete a CSAT survey (but they could of course log a complaint and might get included in more periodical surveys).
So, maybe the level of call abandonment is hiding more than we know?
What’s the Impact of the Call Abandonment Rate?
Firstly, is the abandoned call the last call to the IT service desk that the end user will make (unless they really, really need to call again)? If so, then this can’t be good.
Then, a number of the metrics reported by the IT service desk could be incorrect. Here are two good examples:
- The CSAT measurement is an obvious one to question (relative to the potential impact of “ignoring” the abandoned calls). Would the makers of abandoned calls – the 5%, say, of calling end users who “hung up” – be likely to give low/negative feedback responses if asked? If so, this would have a big impact on CSAT scores because:
- Unhappy customers are more likely to complete a CSAT survey
- Any organization receiving only a 5-15% feedback response level for CSAT (which is pretty common) will see a big drop in their overall score if these additional negative responses are included
- Does the average speed to answer metric take into account abandoned calls? For instance, does an organization’s performance metric of say “90% of calls are answered within SLA” completely ignore its 5% abandonment rate (i.e. we conveniently ignore the people that gave up waiting on us in busy periods)? Of course, the SLA could stipulate that the target is net of abandoned calls, but surely any modern telephony system could provide data on the level of abandoned calls inside and outside the SLA target.
Then finally, does call abandonment also skew other IT service desk metrics, albeit less significantly? For example, ticket volume trends, the percentage of tickets resolved by level (say, if abandoned calls relate to easy-to-resolve tickets), or the percentage of tickets received by channel. It could also affect the CSAT for other channels where the end user has first tried, unsuccessfully, to call.
Dissecting the Measurement of Abandoned Calls
So, maybe there’s a better approach to take – like reporting call abandonment relative to the call-answering SLA target. Such that abandoned calls inside the call-answering (speed) SLA shouldn’t reflect poorly on the IT service desk, unlike those that are due to the inability to answer the phone in a timely manner.
Think about it – a 10% call abandonment rate, where only 1% were outside the call-answering SLA seems reasonable. Whereas a 5% call abandonment rate, where 4% were outside the call-answering SLA doesn’t. With the non-inclusion of this 4% potentially an overstatement of the service desk’s true performance, i.e. speed of answering and CSAT are higher than they would be if these abandoned calls are included.
Hopefully this makes sense – that abandoned call rate is a popular IT service desk metric but also one that potentially hides operational issues. For me, there’s a simple solution – through dissecting the measurement – but what do you think? Please let me know in the comments.